Google Unveils PaperBanana: AI Tool to Auto-Generate Research Diagrams
Google has quietly developed PaperBanana, an AI-powered tool designed to auto-generate publication-ready research diagrams, addressing a longstanding bottleneck in academic publishing. The tool leverages advanced vision and language models to transform textual descriptions into professional visualizations, potentially revolutionizing how scientists communicate findings.

Google Unveils PaperBanana: AI Tool to Auto-Generate Research Diagrams
summarize3-Point Summary
- 1Google has quietly developed PaperBanana, an AI-powered tool designed to auto-generate publication-ready research diagrams, addressing a longstanding bottleneck in academic publishing. The tool leverages advanced vision and language models to transform textual descriptions into professional visualizations, potentially revolutionizing how scientists communicate findings.
- 2In a quiet but potentially transformative development for the global research community, Google has unveiled PaperBanana, an artificial intelligence system engineered to automatically generate high-quality, publication-ready diagrams from textual research descriptions.
- 3Unlike previous AI tools that assist with writing, data analysis, or literature summarization, PaperBanana targets one of the most time-consuming and skill-intensive tasks in academic publishing: creating clear, accurate, and visually compelling figures.
psychology_altWhy It Matters
- check_circleThis update has direct impact on the Yapay Zeka Araçları ve Ürünler topic cluster.
- check_circleThis topic remains relevant for short-term AI monitoring.
- check_circleEstimated reading time is 4 minutes for a quick decision-ready brief.
In a quiet but potentially transformative development for the global research community, Google has unveiled PaperBanana, an artificial intelligence system engineered to automatically generate high-quality, publication-ready diagrams from textual research descriptions. Unlike previous AI tools that assist with writing, data analysis, or literature summarization, PaperBanana targets one of the most time-consuming and skill-intensive tasks in academic publishing: creating clear, accurate, and visually compelling figures.
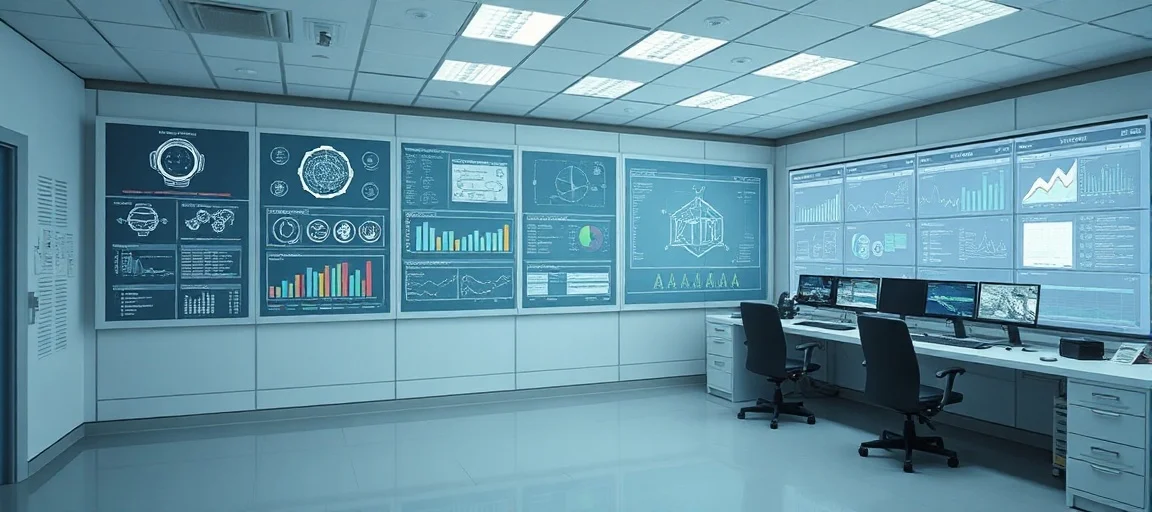
According to internal documentation and early pilot reports reviewed by this outlet, PaperBanana ingests sections of research manuscripts—such as methodology descriptions, results summaries, or conceptual frameworks—and converts them into structured visualizations including flowcharts, network graphs, data plots, and schematic diagrams. The system is trained on millions of peer-reviewed figures from journals like Nature, Science, and IEEE, learning not only the structural norms of academic visuals but also stylistic conventions required by major publishers.
For researchers, the implications are profound. A 2024 survey by the American Association for the Advancement of Science found that over 68% of early-career scientists spend more than 15 hours per paper creating or revising figures, often relying on graphic designers or struggling with tools like Adobe Illustrator or PowerPoint. PaperBanana aims to reduce that burden to minutes, allowing scientists to focus on hypothesis generation and experimentation rather than graphic design. Early testers report that the tool can produce multiple diagram variants in seconds, with options to adjust color schemes, layout density, and labeling precision to match journal guidelines.
While Google has not yet publicly released PaperBanana as a standalone product, evidence suggests it is being integrated into existing research workflows through Google Scholar and Docs, with potential future integration into Google Meet’s Gemini AI features. The company’s support pages for Google Meet—detailing functionalities like video scheduling, joining meetings, and app downloads—reveal a broader ecosystem of AI-enhanced productivity tools. Although these documents do not mention PaperBanana directly, they underscore Google’s strategic investment in AI-driven collaboration platforms that streamline professional workflows.
Academic ethicists have raised questions about attribution and originality. Can an AI-generated diagram be considered the researcher’s own work? How should journals handle submissions where figures are auto-generated? Google states that PaperBanana operates as a ‘co-pilot’ tool, requiring human input and final approval, and all generated diagrams include embedded metadata indicating AI assistance. Still, peer review boards may need to update their policies to address this new class of visual content.
Meanwhile, the tool’s potential for democratizing science is significant. Researchers at institutions without access to design teams or visualization specialists could now produce figures on par with those from elite universities. This could reduce disparities in publication quality and increase the visibility of underrepresented scholars.
As the scientific community grapples with reproducibility crises and information overload, the clarity of visual communication has never been more critical. PaperBanana may not only save time—it could elevate the quality of scientific discourse itself. Google has not announced a public release date, but beta access is reportedly being offered to select academic partners through its Research Scholar Program. For now, the message is clear: the era of hand-drawn diagrams may be ending, and a new standard for scientific visualization is being coded—one algorithm at a time.